Market Outlook
June 13, 2017
Market Cues
Domestic Indices
Chg (%)
(Pts)
(Close)
Indian markets are likely to open flat and may remain negative biased tracking the
BSE Sensex
(0.5)
(166)
31,096
global cues.
Nifty
(0.5)
(52)
9,616
After moving to the downside early in the session, US markets remained mostly
Mid Cap
(0.5)
(79)
14,796
negative throughout the trading day on Monday. The tech-heavy Nasdaq
Small Cap
(0.6)
(95)
15,454
underperformed its counterparts, pulling back further off the record closing high set
last Thursday. The weakness on Wall Street was partly due to profit taking, with
Bankex
(1.0)
(274)
26,547
traders cashing in on some of the recent strength in the markets.
Global Indices
Chg (%)
(Pts)
(Close)
The European markets ended the first trading day of the new week solidly in
negative territory. The continued political uncertainty in the UK weighed on investor
Dow Jones
(0.2)
(36)
21,236
sentiment, while a weak performance by the technology stocks also contributed to
Nasdaq
(0.5)
(32)
6,175
the negative mood.
FTSE
(0.2)
(15)
7,512
Indian markets ended notably lower on Monday as investors awaited industrial
Nikkei
(0.5)
(105)
19,909
output and inflation data due out later in the day as well as Wednesday's Federal
Hang Seng
(1.2)
(322)
25,708
Reserve policy meeting for directional cues.
Shanghai Com
(0.6)
(19)
3,140
News Analysis
Advances / Declines
BSE
NSE
Axis Bank to issue debentures to raise `5,000Cr
Detailed analysis on Pg2
Advances
1,032
1,572
Declines
1,705
1,111
Investor’s Ready Reckoner
Unchanged
154
69
Key Domestic & Global Indicators
Stock Watch: Latest investment recommendations on 150+ stocks
Volumes (` Cr)
Refer Pg5 onwards
BSE
3,281
Top Picks
NSE
20,225
CMP
Target
Upside
Company
Sector
Rating
(`)
(`)
(%)
Blue Star
Capital Goods
Buy
636
760
19.5
#Net Inflows (` Cr)
Net
Mtd
Ytd
Dewan Housing Fin. Financials
Buy
428
520
21.4
FII
(56(69)
(1,490)
50,479
Mahindra Lifespace Real Estate
Buy
416
522
25.6
MFs
804
(9)
2,412
32,451
Navkar Corporation Others
Buy
213
265
24.6
KEI Industries
Capital Goods
Buy
217
258
19.2
Top Gainers
Price (`)
Chg (%)
More Top Picks on Pg3
Repcohome
847
5.3
Key Upcoming Events
Gmrinfra
18
4.7
Previous
Consensus
Date
Region
Event Description
Reading
Expectations
Mothersumi
479
4.3
Jun 13, 2017 UK
CPI (YoY)
2.70
2.70
Persistent
656
4.2
Jun 14, 2017 India
Imports YoY%
49.10
Gruh
445
4.2
Jun 14, 2017 US
Producer Price Index (mom)
0.60
Jun 14, 2017 India
Exports YoY%
19.80
Top Losers
Price (`)
Chg (%)
Jun 14, 2017 US
Consumer price index (mom)
0.20
-
Jun 14, 2017 UK
Jobless claims change
19.40
Bharatfin
695
(5.0)
More Events on Pg4
Videoind
27
(4.9)
Natcopharm
1,021
(4.8)
Unionbank
151
(4.6)
Tatacomm
734
(4.3)
#as on 12th June, 2017
Market Outlook
June 13, 2017
News Analysis
Axis Bank to issue debentures to raise `5,000Cr
Axis Bank, country’s third largest private bank, on Monday said it will raise `5,000
cr by issuing non-convertible debt securities. The bank proposes to "raise funds by
issuing unsecured Redeemable Non-Convertible Subordinated Debentures, Basel-
III Compliant Tier 2 Debentures (Series 27) of the face value of `10 lakh each for
cash at par aggregating to `5,000cr, Axis Bank said in a regulatory filing on stock
exchanges.
The fund raising will take place after approval from the bank’s Board. In
December 2016, Axis Bank raised `3,500cr by selling perpetual bonds, becoming
the first bank to do so. The new fund raising will help the bank boost its capital
buffer and meet the Basel III requirements as mandated by RBI. According to
Basel-III norms, which kick in from March 2019, Indian banks need to maintain a
minimum capital adequacy ratio (CAR) of
11.5 percent including capital
conservation buffer in the form of common equity. Axis bank’s CAR as on March
end 2017 stood at 14.95 percent, with a tier-I ratio at 11.87 percent while tier II at
3.08 percent.
Economic and Political News
Govt rules out centralised registration for banks under GST
India Inc pitches for RBI rate cut as April IIP growth slips to 3.1%
India's fuel demand rose 5.4% in May
Close to resolving some stressed power projects: Piyush Goyal
Corporate News
Tamil Nadu holds trial run of Ashok Leyland's electric bus, may induct soon
Anrak Aluminium looks to Odisha for bauxite supplies
Huawei claims to have overtaken Apple in global sales volume
TCS, Intel join hands to provide solutions for firms to go digital
Wipro ADRs slump on the NYSE; company clarifies on bonus issue
Market Outlook
June 13, 2017
Top Picks ★★★★★
Market Cap
CMP
Target
Upside
Company
Rationale
(` Cr)
(`)
(`)
(%)
Strong growth in domestic business due to its leadership
in acute therapeutic segment. Alkem expects to launch
Alkem Laboratories
23,063
1,929
2,161
12.0
more products in USA, which bodes for its international
business.
We expect the company would report strong profitability
Asian Granito
1,181
393
447
13.9
owing to better product mix, higher B2C sales and
amalgamation synergy.
Favourable outlook for the AC industry to augur well for
Cooling products business which is out pacing the market
Blue Star
6,079
636
760
19.5
growth. EMPPAC division's profitability to improve once
operating environment turns around.
With a focus on the low and medium income (LMI)
consumer segment, the company has increased its
Dewan Housing Finance
13,422
428
520
21.4
presence in tier-II & III cities where the growth opportunity
is immense.
Loan growth is likely to pick up after a sluggish FY17.
Karur Vysya Bank
7,799
129
160
24.0
Lower credit cost will help in strong bottomline growth.
Increasing share of CASA will help in NIM improvement.
Economic recovery to have favourable impact on
advertising & circulation revenue growth. Further, the
Jagran Prakashan
6,020
184
225
22.2
acquisition of a radio business (Radio City) would also
boost the company's revenue growth.
High order book execution in EPC segment, rising B2C
KEI Industries
1,684
217
258
19.2
sales and higher exports to boost the revenues and
profitability
Speedier execution and speedier sales, strong revenue
Mahindra Lifespace
2,133
416
522
25.6
visibilty in short-to-long run, attractive valuations
Massive capacity expansion along with rail advantage at
Navkar Corporation
3,033
213
265
24.6
ICD as well CFS augurs well for the company
Strong brands and distribution network would boost
Siyaram Silk Mills
2,166
2,311
2,500
8.2
growth going ahead. Stock currently trades at an
inexpensive valuation.
Market leadership in Hindi news genre and no.
2
viewership ranking in English news genre, exit from the
TV Today Network
1,570
263
344
30.7
radio business, and anticipated growth in ad spends by
corporates to benefit the stock.
Source: Company, Angel Research
Market Outlook
June 13, 2017
Key Upcoming Events
Global economic events release calendar
Bloomberg Data
Date
Time
Country
Event Description
Unit
Period
Last Reported
Estimated
Jun 13, 2017
2:00 PMUK
CPI (YoY)
% Change
May
2.70
2.70
India
Imports YoY%
% Change
May
49.10
Jun 14, 2017
US
Producer Price Index (mom)
% Change
May
0.60
India
Exports YoY%
% Change
May
19.80
6:00 PMUS
Consumer price index (mom)
% Change
May
0.20
-
2:00 PMUK
Jobless claims change
% Change
May
19.40
7:30 AMChina
Industrial Production (YoY)
% Change
May
6.50
6.40
12:00 PMIndia
Monthly Wholesale Prices YoY%
% Change
May
3.85
2.90
11:30 PMUS
FOMC rate decision
%
Jun 14
1.00
1.25
Jun 15, 2017
6:00 PMUS
Initial Jobless claims
Thousands
Jun 10
245.00
241.00
6:45 PMUS
Industrial Production
%
May
0.98
0.20
4:30 PMUK
BOE Announces rates
% Ratio
Jun 15
0.25
0.25
Jun 16, 2017
2:30 PMEuro Zone Euro-Zone CPI (YoY)
%
May F
1.40
1.40
6:00 PMUS
Housing Starts
Thousands
May
1,172.00
1,218.00
6:00 PMUS
Building permits
Thousands
May
1,228.00
1,250.00
Jun 21, 2017
7:30 PMUS
Existing home sales
Million
May
5.57
5.55
Jun 22, 2017
1:00 PMGermany PMI Services
Value
Jun P
55.40
Jun 23, 2017
7:30 PMEuro Zone Euro-Zone Consumer Confidence
Value
Jun A
(3.30)
1:00 PMGermany PMI Manufacturing
Value
Jun P
59.50
7:30 PMUS
New home sales
Thousands
May
569.00
600.00
Jun 27, 2017
7:30 PMUS
Consumer Confidence
S.A./ 1985=100 Jun
117.90
Jun 29, 2017
6:00 PMUS
GDP Qoq (Annualised)
% Change
1Q T
1.20
Source: Bloomberg, Angel Research
Market Outlook
June 13, 2017
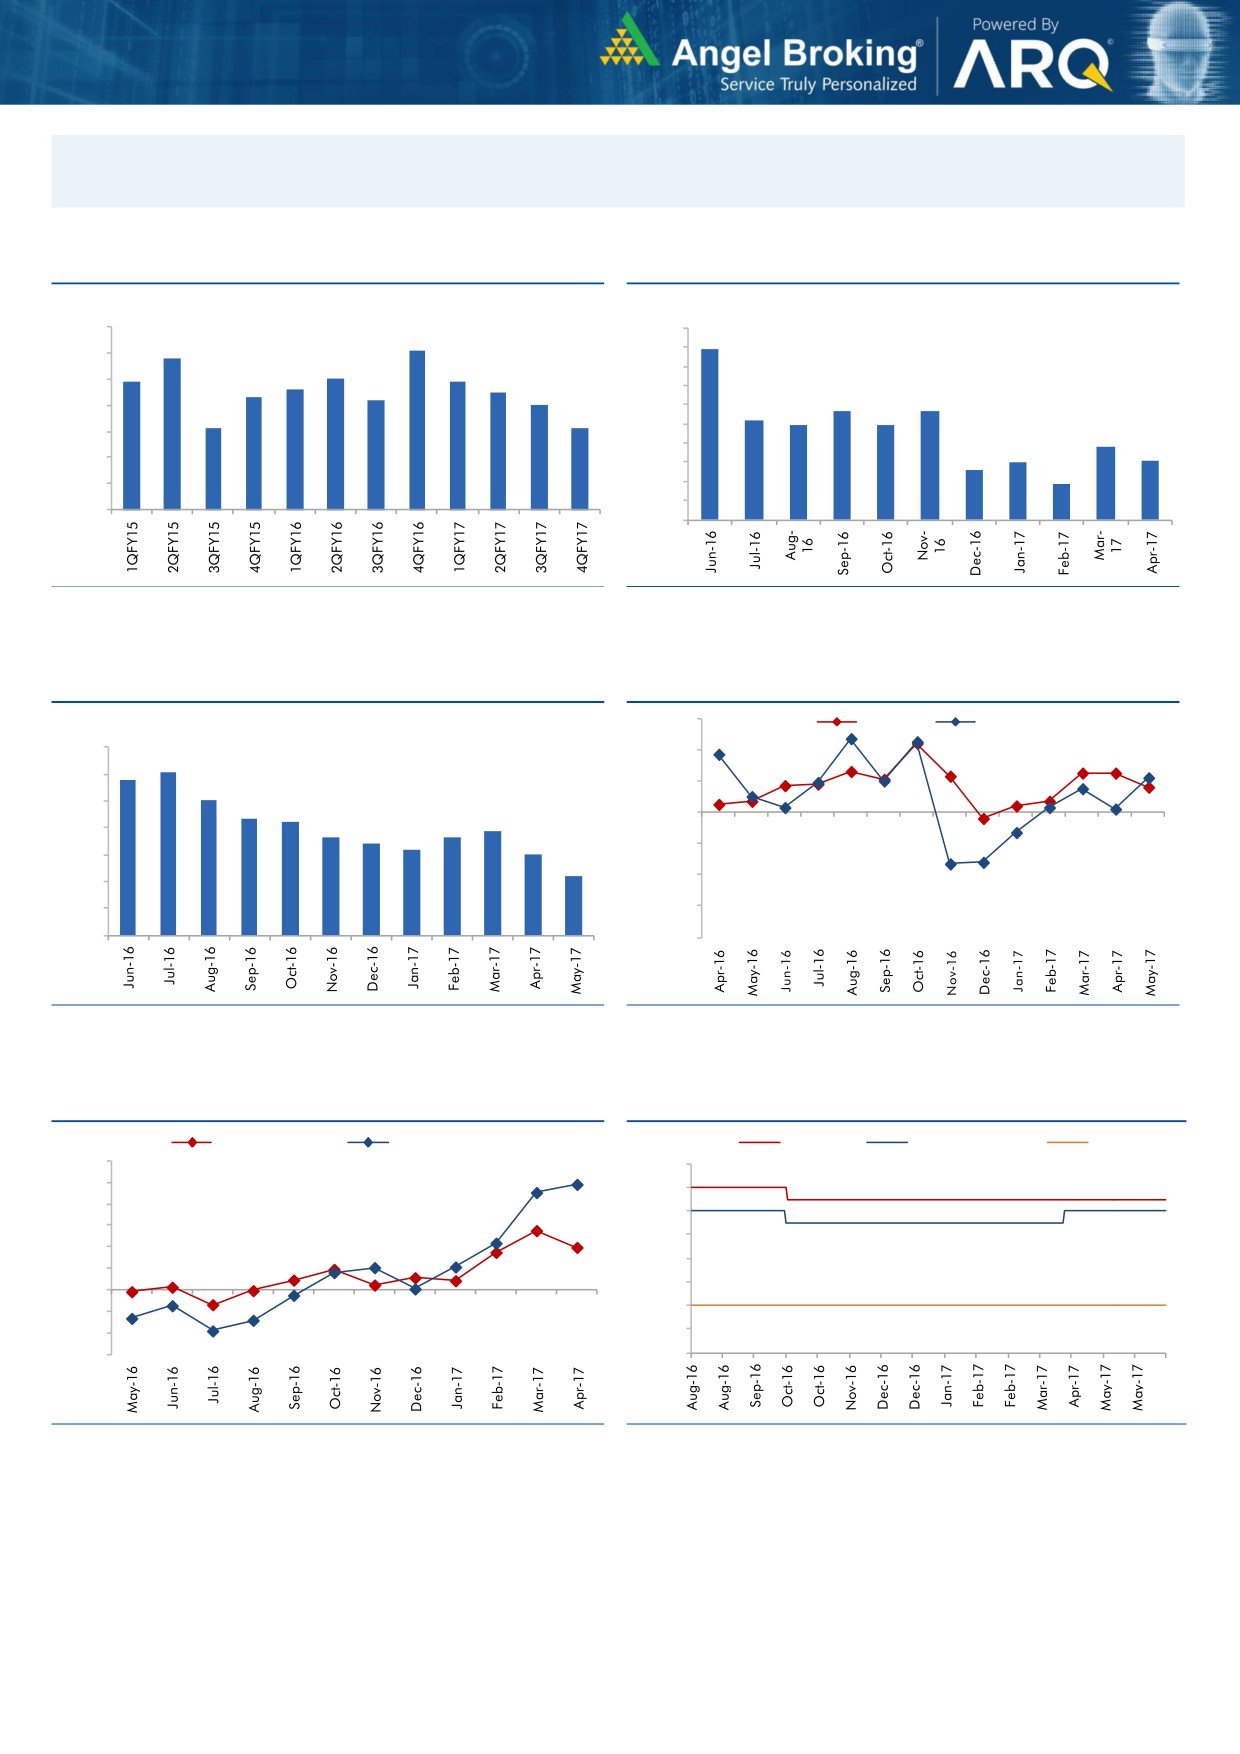
Macro watch
Exhibit 1: Quarterly GDP trends
Exhibit 2: IIP trends
(%)
(%)
10.0
10.0
9.1
8.9
8.8
9.0
9.0
7.9
8.0
7.9
8.0
7.6
7.5
8.0
7.3
7.2
7.0
7.0
5.7
5.7
7.0
6.0
5.2
6.1
6.1
4.9
4.9
6.0
5.0
3.8
4.0
3.0
3.1
2.6
5.0
3.0
1.9
4.0
2.0
1.0
3.0
-
Source: CSO, Angel Research
Source: MOSPI, Angel Research
Exhibit 3: Monthly CPI inflation trends
Exhibit 4: Manufacturing and services PMI
56.0
Mfg. PMI
Services PMI
(%)
7.0
54.0
6.1
5.8
6.0
5.1
52.0
5.0
4.3
4.2
3.9
50.0
3.6
3.7
4.0
3.4
3.2
3.0
48.0
3.0
2.2
46.0
2.0
1.0
44.0
-
42.0
Source: MOSPI, Angel Research
Source: Market, Angel Research; Note: Level above 50 indicates expansion
Exhibit 5: Exports and imports growth trends
Exhibit 6: Key policy rates
(%)
Exports yoy growth
Imports yoy growth
(%)
Repo rate
Reverse Repo rate
CRR
60.0
7.00
50.0
6.50
40.0
6.00
30.0
5.50
20.0
5.00
10.0
4.50
0.0
4.00
(10.0)
(20.0)
3.50
(30.0)
3.00
Source: Bloomberg, Angel Research
Source: RBI, Angel Research
Market Outlook
June 13, 2017
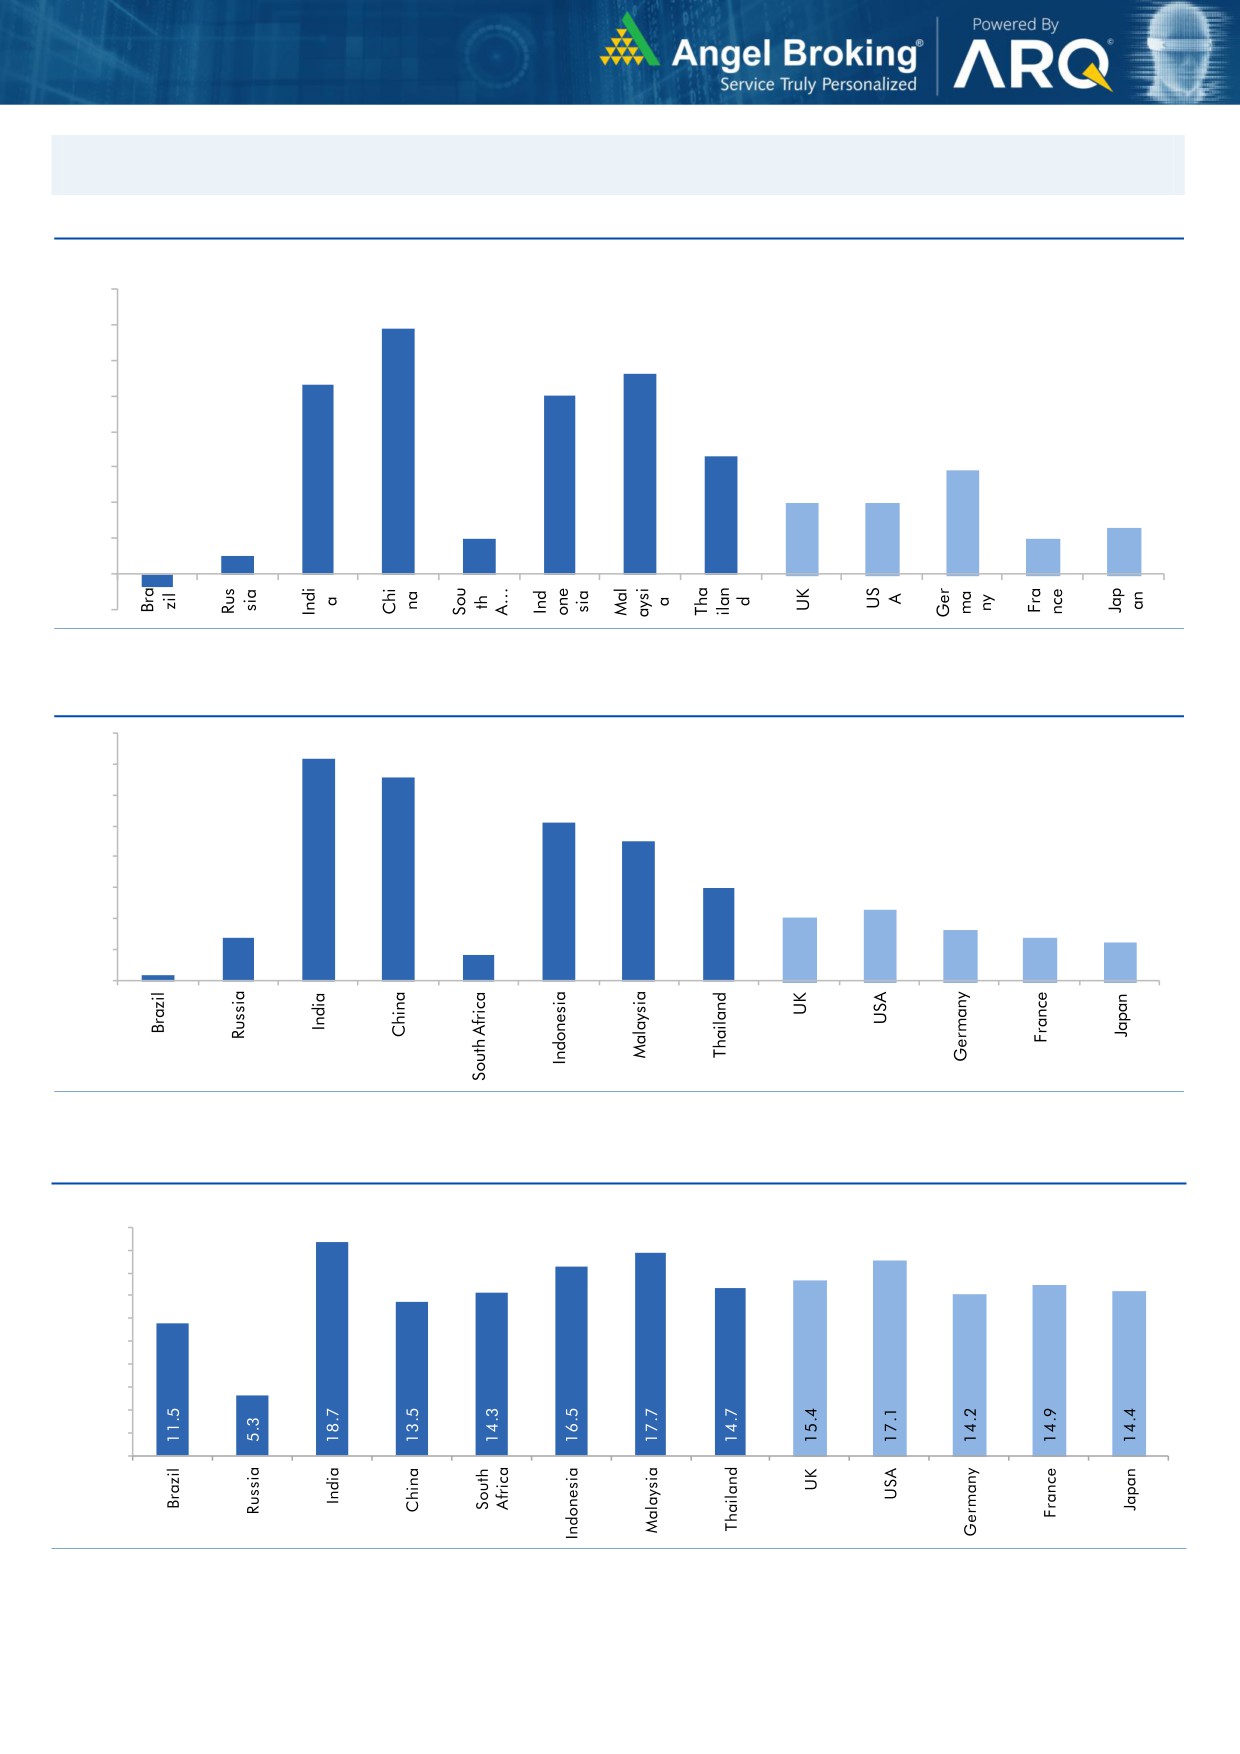
Global watch
Exhibit 1: Latest quarterly GDP Growth (%, yoy) across select developing and developed countries
(%)
8.0
6.9
7.0
6.0
5.6
5.3
5.0
5.0
1.0
4.0
3.3
2.9
3.0
2.0
2.0
2.0
0.5
1.3
1.0
1.0
-
(1.0)
(0.4)
Source: Bloomberg, Angel Research
Exhibit 2: 2016 GDP Growth projection by IMF (%, yoy) across select developing and developed countries
(%)
7.2
6.6
7.0
6.0
5.1
5.0
4.5
4.0
3.0
3.0
2.3
2.0
1.4
1.6
2.0
1.4
1.2
0.2
0.8
1.0
-
Source: IMF, Angel Research
Exhibit 3: One year forward P-E ratio across select developing and developed countries
(x)
20.0
18.0
16.0
14.0
12.0
10.0
8.0
6.0
4.0
2.0
-
Source: IMF, Angel Research
Market Outlook
June 13, 2017
Exhibit 4: Relative performance of indices across globe
Returns (%)
Country
Name of index
Closing price
1M
3M
1YR
Brazil
Bovespa
61,700
(8.6)
(4.5)
20.7
Russia
Micex
1,883
(7.1)
(7.0)
(0.1)
India
Nifty
9,616
2.1
7.8
16.3
China
Shanghai Composite
3,140
2.8
(3.2)
11.2
South Africa
Top 40
45,169
(4.9)
1.9
(5.3)
Mexico
Mexbol
49,129
(0.8)
3.3
9.3
Indonesia
LQ45
954
1.2
7.1
16.8
Malaysia
KLCI
1,789
1.3
4.2
9.7
Thailand
SET 50
985
(0.5)
1.1
7.4
USA
Dow Jones
21,236
1.4
1.6
19.8
UK
FTSE
7,512
2.5
2.6
24.5
Japan
Nikkei
19,909
0.6
3.5
20.8
Germany
DAX
12,690
(0.5)
6.0
32.9
France
CAC
5,241
(2.7)
5.2
20.7
Source: Bloomberg, Angel Research
Stock Watch
June 13, 2017
Company Name
Reco
CMP
Target
Mkt Cap
Sales ( Čcr )
OPM(%)
EPS (Č)
PER(x)
P/BV(x)
RoE(%)
EV/Sales(x)
(Č)
Price ( Č)
( Č cr )
FY17E FY18E
FY17E
FY18E
FY17E
FY18E
FY17E
FY18E
FY17E
FY18E
FY17E
FY18E
FY17E
FY18E
Agri / Agri Chemical
Rallis
Neutral
248
-
4,813
1,937
2,164
13.3
14.3
9.0
11.0
27.5
22.5
4.8
4.2
18.4
19.8
2.5
2.2
United Phosphorus
Neutral
843
-
42,807
15,176
17,604
18.5
18.5
37.4
44.6
22.5
18.9
4.4
3.7
21.4
21.2
2.9
2.5
Auto & Auto Ancillary
Ashok Leyland
Buy
94
111
26,780
20,021
21,915
11.6
11.9
4.5
5.3
20.9
17.7
4.3
3.8
20.6
21.5
1.3
1.1
Bajaj Auto
Neutral
2,827
-
81,801
25,093
27,891
19.5
19.2
143.9
162.5
19.6
17.4
5.5
4.7
30.3
29.4
3.0
2.6
Bharat Forge
Neutral
1,170
-
27,229
7,726
8,713
20.5
21.2
35.3
42.7
33.1
27.4
6.1
5.5
18.9
20.1
3.6
3.1
Eicher Motors
Neutral
29,312
-
79,792
16,583
20,447
17.5
18.0
598.0
745.2
49.0
39.3
16.8
12.8
41.2
38.3
4.6
3.7
Gabriel India
Neutral
143
-
2,054
1,544
1,715
9.0
9.3
5.4
6.3
26.5
22.7
5.0
4.4
18.9
19.5
1.3
1.1
Hero Motocorp
Neutral
3,775
-
75,379
28,083
30,096
15.3
15.7
171.8
187.0
22.0
20.2
7.7
6.4
30.1
27.9
2.5
2.3
Jamna Auto Industries Neutral
264
-
2,105
1,486
1,620
9.8
9.9
15.0
17.2
17.6
15.4
3.9
3.3
21.8
21.3
1.5
1.3
L G Balakrishnan & Bros Neutral
747
-
1,173
1,302
1,432
11.6
11.9
43.7
53.0
17.1
14.1
2.4
2.2
13.8
14.2
1.0
0.9
Mahindra and Mahindra Neutral
1,424
-
88,462
46,534
53,077
11.6
11.7
67.3
78.1
21.2
18.3
3.4
3.0
15.4
15.8
1.9
1.6
Maruti
Neutral
7,381
-
222,970
67,822
83,288
16.0
16.4
253.8
312.4
29.1
23.6
6.7
5.4
23.0
22.9
3.0
2.3
Minda Industries
Neutral
596
-
5,150
2,728
3,042
9.0
9.1
68.2
86.2
8.7
6.9
2.0
1.6
23.8
24.3
2.0
1.7
Motherson Sumi
Neutral
479
-
67,251
45,896
53,687
7.8
8.3
13.0
16.1
36.7
29.8
11.8
9.4
34.7
35.4
1.5
1.3
Rane Brake Lining
Neutral
1,343
-
1,063
511
562
11.3
11.5
28.1
30.9
47.8
43.5
7.3
6.6
15.3
15.0
2.2
2.0
Setco Automotive
Neutral
39
-
518
741
837
13.0
13.0
15.2
17.0
2.6
2.3
0.4
0.4
15.8
16.3
1.1
1.0
Tata Motors
Neutral
457
-
131,807
300,209
338,549
8.9
8.4
42.7
54.3
10.7
8.4
1.7
1.4
15.6
17.2
0.6
0.5
TVS Motor
Neutral
552
-
26,237
13,390
15,948
6.9
7.1
12.8
16.5
43.3
33.4
10.8
8.5
26.3
27.2
2.0
1.7
Amara Raja Batteries
Buy
848
1,009
14,477
5,305
6,100
16.0
16.3
28.4
34.0
29.8
24.9
5.8
4.8
19.3
19.3
2.7
2.4
Exide Industries
Neutral
224
-
19,044
7,439
8,307
15.0
15.0
8.1
9.3
27.7
24.1
3.9
3.5
14.3
16.7
2.2
1.9
Apollo Tyres
Neutral
260
-
13,242
12,877
14,504
14.3
13.9
21.4
23.0
12.1
11.3
1.9
1.6
16.4
15.2
1.2
1.1
Ceat
Neutral
1,906
-
7,709
7,524
8,624
13.0
12.7
131.1
144.3
14.5
13.2
2.7
2.3
19.8
18.6
1.1
1.0
JK Tyres
Neutral
179
-
4,067
7,455
8,056
15.0
15.0
21.8
24.5
8.2
7.3
1.7
1.4
22.8
21.3
0.7
0.6
Swaraj Engines
Neutral
2,204
-
2,738
660
810
15.2
16.4
54.5
72.8
40.5
30.3
12.6
11.4
31.5
39.2
4.0
3.2
Subros
Neutral
260
-
1,560
1,488
1,681
11.7
11.9
6.4
7.2
40.6
36.3
4.3
3.9
10.8
11.4
1.3
1.1
Indag Rubber
Neutral
215
-
563
286
326
19.8
16.8
11.7
13.3
18.4
16.1
3.1
2.9
17.8
17.1
1.6
1.4
Capital Goods
ACE
Neutral
64
-
629
709
814
4.1
4.6
1.4
2.1
45.4
30.3
1.9
1.8
4.4
6.0
1.0
0.9
BEML
Neutral
1,295
-
5,392
3,451
4,055
6.3
9.2
31.4
57.9
41.2
22.4
2.5
2.3
6.3
10.9
1.7
1.4
Bharat Electronics
Neutral
166
-
36,989
8,137
9,169
16.8
17.2
58.7
62.5
2.8
2.7
0.4
0.4
44.6
46.3
3.5
3.2
Stock Watch
June 13, 2017
Company Name
Reco
CMP
Target
Mkt Cap
Sales ( Čcr )
OPM(%)
EPS (Č)
PER(x)
P/BV(x)
RoE(%)
EV/Sales(x)
(Č)
Price ( Č)
( Č cr )
FY17E
FY18E
FY17E
FY18E
FY17E
FY18E
FY17E
FY18E
FY17E
FY18E
FY17E
FY18E
FY17E
FY18E
Capital Goods
Voltas
Neutral
486
-
16,084
6,511
7,514
7.9
8.7
12.9
16.3
37.7
29.8
6.8
5.9
16.7
18.5
2.2
1.9
BGR Energy
Neutral
153
-
1,105
16,567
33,848
6.0
5.6
7.8
5.9
19.6
26.0
1.1
1.1
4.7
4.2
0.2
0.1
BHEL
Neutral
139
-
34,058
28,797
34,742
-
2.8
2.3
6.9
60.5
20.2
1.0
1.0
1.3
4.8
0.8
0.6
Blue Star
Buy
636
760
6,079
4,283
5,077
5.9
7.3
14.9
22.1
42.7
28.7
8.3
7.0
20.4
26.4
1.5
1.2
CG Power and Industrial
Neutral
82
-
5,142
5,777
6,120
5.9
7.0
3.3
4.5
24.9
18.2
1.1
1.0
4.4
5.9
0.8
0.7
Solutions
Greaves Cotton
Neutral
157
-
3,822
1,755
1,881
16.8
16.9
7.8
8.5
20.1
18.4
4.0
3.7
20.6
20.9
1.9
1.7
Inox Wind
Neutral
139
-
3,081
5,605
6,267
15.7
16.4
24.8
30.0
5.6
4.6
1.6
1.2
25.9
24.4
0.6
0.5
KEC International
Neutral
260
-
6,696
9,294
10,186
7.9
8.1
9.9
11.9
26.3
21.9
3.9
3.4
15.6
16.3
1.0
0.9
KEI Industries
Buy
217
258
1,684
2,633
3,001
10.4
10.0
12.7
13.0
17.0
16.6
3.6
3.0
21.4
18.2
0.8
0.7
Thermax
Neutral
955
-
11,384
5,421
5,940
7.3
7.3
25.7
30.2
37.2
31.6
4.5
4.1
12.2
13.1
2.0
1.8
VATech Wabag
Neutral
690
-
3,767
3,136
3,845
8.9
9.1
26.0
35.9
26.6
19.2
3.3
2.8
13.4
15.9
1.1
0.9
Cement
ACC
Neutral
1,606
-
30,161
11,225
13,172
13.2
16.9
44.5
75.5
36.1
21.3
3.4
3.2
11.2
14.2
2.7
2.3
Ambuja Cements
Neutral
231
-
45,898
9,350
10,979
18.2
22.5
5.8
9.5
39.9
24.3
3.4
3.0
10.2
12.5
4.9
4.2
India Cements
Neutral
211
-
6,471
4,364
4,997
18.5
19.2
7.9
11.3
26.7
18.6
1.9
1.9
8.0
8.5
2.2
2.0
JK Cement
Neutral
1,021
-
7,141
4,398
5,173
15.5
17.5
31.2
55.5
32.7
18.4
3.9
3.4
12.0
15.5
2.2
1.8
J K Lakshmi Cement
Neutral
477
-
5,613
2,913
3,412
14.5
19.5
7.5
22.5
63.6
21.2
3.9
3.3
12.5
18.0
2.5
2.1
Orient Cement
Neutral
155
-
3,166
2,114
2,558
18.5
20.5
8.1
11.3
19.1
13.7
2.8
2.4
9.0
14.0
2.1
1.7
UltraTech Cement
Neutral
4,047
-
111,094
25,768
30,385
21.0
23.5
111.0
160.0
36.5
25.3
4.7
4.1
13.5
15.8
4.4
3.7
Construction
ITNL
Neutral
97
-
3,197
8,946
10,017
31.0
31.6
8.1
9.1
12.0
10.7
0.4
0.5
4.2
5.0
3.7
3.4
KNR Constructions
Neutral
214
-
3,008
1,385
1,673
14.7
14.0
41.2
48.5
5.2
4.4
1.0
0.8
14.9
15.2
2.3
1.9
Larsen & Toubro
Neutral
1,736
-
162,041
111,017
124,908
11.0
11.0
61.1
66.7
28.4
26.0
3.4
3.2
13.1
12.9
2.5
2.3
Gujarat Pipavav Port
Neutral
138
-
6,679
705
788
52.2
51.7
5.0
5.6
27.6
24.7
2.7
2.5
11.2
11.2
9.1
7.7
Nagarjuna Const.
Neutral
91
-
5,059
8,842
9,775
9.1
8.8
5.3
6.4
17.2
14.2
1.4
1.3
8.2
9.1
0.7
0.6
PNC Infratech
Neutral
147
-
3,767
2,350
2,904
13.1
13.2
9.0
8.8
16.3
16.7
0.6
0.5
15.9
13.9
1.7
1.4
Simplex Infra
Neutral
519
-
2,566
6,829
7,954
10.5
10.5
31.4
37.4
16.5
13.9
1.7
1.6
9.9
13.4
0.8
0.7
Power Mech Projects
Neutral
585
-
861
1,801
2,219
12.7
14.6
72.1
113.9
8.1
5.1
1.5
1.3
16.8
11.9
0.5
0.4
Sadbhav Engineering
Neutral
305
-
5,226
3,598
4,140
10.3
10.6
9.0
11.9
33.8
25.6
3.5
3.1
9.9
11.9
1.7
1.5
NBCC
Neutral
199
-
17,874
7,428
9,549
7.9
8.6
8.2
11.0
24.2
18.1
1.2
1.0
28.2
28.7
2.1
1.6
MEP Infra
Neutral
88
-
1,435
1,877
1,943
30.6
29.8
3.0
4.2
29.4
21.0
14.2
9.6
0.6
0.6
2.1
2.0
Stock Watch
June 13, 2017
Company Name
Reco
CMP
Target
Mkt Cap
Sales ( Čcr )
OPM(%)
EPS (Č)
PER(x)
P/BV(x)
RoE(%)
EV/Sales(x)
(Č)
Price ( Č)
( Č cr )
FY17E
FY18E
FY17E
FY18E
FY17E
FY18E
FY17E
FY18E
FY17E
FY18E
FY17E
FY18E
FY17E
FY18E
Construction
SIPL
Neutral
110
-
3,889
1,036
1,252
65.5
66.2
(8.4)
(5.6)
4.1
4.7
(22.8)
(15.9)
12.0
10.0
Engineers India
Neutral
151
-
10,206
1,725
1,935
16.0
19.1
11.4
13.9
13.3
10.9
1.8
1.8
13.4
15.3
4.9
4.3
Financials
Axis Bank
Accumulate
507
580
121,612
46,932
53,575
3.5
3.4
32.4
44.6
15.7
11.4
2.0
1.8
13.6
16.5
-
-
Bank of Baroda
Neutral
168
-
38,779
19,980
23,178
1.8
1.8
11.5
17.3
14.6
9.7
1.7
1.4
8.3
10.1
-
-
Canara Bank
Neutral
346
-
20,663
15,225
16,836
1.8
1.8
14.5
28.0
23.9
12.4
1.7
1.3
5.8
8.5
-
-
Can Fin Homes
Neutral
3,025
-
8,052
420
526
3.5
3.5
86.5
107.8
35.0
28.1
7.5
6.2
23.6
24.1
-
-
Cholamandalam Inv. &
Buy
1,042
1,230
16,290
2,012
2,317
6.3
6.3
42.7
53.6
24.4
19.4
3.9
3.3
16.9
18.3
-
-
Fin. Co.
Dewan Housing Finance Buy
428
520
13,422
2,225
2,688
2.9
2.9
29.7
34.6
14.4
12.4
2.3
1.5
16.1
14.8
-
-
Equitas Holdings
Buy
154
235
5,208
939
1,281
11.7
11.5
5.8
8.2
26.6
18.8
2.3
2.0
10.9
11.5
-
-
Federal Bank
Accumulate
114
125
19,708
8,259
8,995
3.0
3.0
4.3
5.6
26.6
20.4
2.2
2.1
8.5
10.1
-
-
HDFC
Neutral
1,643
-
261,205
11,475
13,450
3.4
3.4
45.3
52.5
36.3
31.3
7.0
6.2
20.2
20.5
-
-
HDFC Bank
Neutral
1,669
-
428,800
46,097
55,433
4.5
4.5
58.4
68.0
28.6
24.6
5.0
4.2
18.8
18.6
-
-
ICICI Bank
Neutral
316
-
184,036
42,800
44,686
3.1
3.3
18.0
21.9
17.5
14.4
2.4
2.2
11.1
12.3
-
-
Karur Vysya Bank
Buy
129
160
7,787
5,640
6,030
3.3
3.2
8.9
10.0
14.5
12.9
1.5
1.4
11.2
11.4
-
-
Lakshmi Vilas Bank
Neutral
194
-
3,726
3,339
3,799
2.7
2.8
11.0
14.0
17.7
13.9
1.8
1.7
11.2
12.7
-
-
LIC Housing Finance
Neutral
757
-
38,226
3,712
4,293
2.6
2.5
39.0
46.0
19.4
16.5
3.6
3.1
19.9
20.1
-
-
Punjab Natl.Bank
Neutral
148
-
31,526
23,532
23,595
2.3
2.4
6.8
12.6
21.8
11.8
3.4
2.4
3.3
6.5
-
-
RBL Bank
Neutral
528
-
19,854
1,783
2,309
2.6
2.6
12.7
16.4
41.6
32.2
4.5
4.1
12.8
13.3
-
-
Repco Home Finance
Neutral
847
-
5,296
388
457
4.5
4.2
30.0
38.0
28.2
22.3
4.7
3.9
18.0
19.2
-
-
South Ind.Bank
Neutral
28
-
5,032
6,435
7,578
2.5
2.5
2.7
3.1
10.3
9.0
1.3
1.1
10.1
11.2
-
-
St Bk of India
Neutral
285
-
231,171
88,650
98,335
2.6
2.6
13.5
18.8
21.1
15.2
2.0
1.8
7.0
8.5
-
-
Union Bank
Neutral
151
-
10,391
13,450
14,925
2.3
2.3
25.5
34.5
5.9
4.4
0.9
0.7
7.5
10.2
-
-
Yes Bank
Neutral
1,483
-
67,800
8,978
11,281
3.3
3.4
74.0
90.0
20.0
16.5
3.8
3.2
17.0
17.2
-
-
FMCG
Akzo Nobel India
Neutral
1,856
-
8,899
2,955
3,309
13.3
13.7
57.2
69.3
32.5
26.8
10.6
8.9
32.7
33.3
2.8
2.5
Asian Paints
Neutral
1,150
-
110,346
17,128
18,978
16.8
16.4
19.1
20.7
60.2
55.6
21.0
19.8
34.8
35.5
6.4
5.7
Britannia
Neutral
3,620
-
43,445
9,594
11,011
14.6
14.9
80.3
94.0
45.1
38.5
18.5
14.3
41.2
-
4.4
3.8
Colgate
Neutral
1,080
-
29,372
4,605
5,149
23.4
23.4
23.8
26.9
45.4
40.1
25.1
19.6
64.8
66.8
6.3
5.6
Dabur India
Accumulate
284
304
50,045
8,315
9,405
19.8
20.7
8.1
9.2
35.1
30.9
9.8
8.1
31.6
31.0
5.7
5.0
GlaxoSmith Con*
Neutral
5,386
-
22,650
4,350
4,823
21.2
21.4
179.2
196.5
30.1
27.4
8.0
6.8
27.1
26.8
4.6
4.1
Stock Watch
June 13, 2017
Company Name
Reco
CMP
Target
Mkt Cap
Sales ( Čcr )
OPM(%)
EPS (Č)
PER(x)
P/BV(x)
RoE(%)
EV/Sales(x)
(Č)
Price ( Č)
( Č cr )
FY17E FY18E
FY17E
FY18E
FY17E
FY18E
FY17E
FY18E
FY17E
FY18E
FY17E
FY18E
FY17E
FY18E
FMCG
Godrej Consumer
Neutral
1,887
-
64,258
10,235
11,428
18.4
18.6
41.1
44.2
45.9
42.7
10.2
8.6
24.9
24.8
6.4
5.6
HUL
Neutral
1,100
-
238,058
35,252
38,495
17.8
17.8
20.7
22.4
53.3
49.1
50.9
43.7
95.6
88.9
6.6
6.0
ITC
Neutral
304
-
369,706
40,059
44,439
38.3
39.2
9.0
10.1
33.9
30.0
9.5
8.3
27.8
27.5
8.7
7.9
Marico
Neutral
314
-
40,579
6,430
7,349
18.8
19.5
6.4
7.7
49.1
40.8
14.8
12.5
33.2
32.5
6.1
5.3
Nestle*
Neutral
6,658
-
64,192
10,073
11,807
20.7
21.5
124.8
154.2
53.4
43.2
21.9
19.7
34.8
36.7
6.2
5.3
Tata Global
Neutral
152
-
9,599
8,675
9,088
9.8
9.8
7.4
8.2
20.6
18.6
1.6
1.5
7.9
8.1
1.0
1.0
Procter & Gamble
Neutral
8,025
-
26,050
2,939
3,342
23.2
23.0
146.2
163.7
54.9
49.0
13.9
11.5
25.3
23.5
8.4
7.3
Hygiene
IT
HCL Tech^
Buy
865
1,014
123,484
46,723
52,342
22.1
20.9
60.0
62.8
14.4
13.8
3.7
3.1
25.3
22.4
2.4
2.0
Infosys
Buy
964
1,179
221,380
68,484
73,963
26.0
26.0
63.0
64.0
15.3
15.1
3.2
3.0
20.8
19.7
2.9
2.6
TCS
Accumulate
2,490
2,651
490,617
117,966
127,403
27.5
27.6
134.3
144.5
18.5
17.2
5.5
5.1
29.8
29.7
3.8
3.5
Tech Mahindra
Buy
398
533
38,746
29,141
31,051
14.4
15.0
32.3
35.6
12.3
11.2
2.1
1.9
17.1
17.0
1.2
1.0
Wipro
Accumulate
526
570
128,053
55,421
58,536
20.3
20.3
35.1
36.5
15.0
14.4
2.6
2.2
19.2
14.6
1.7
1.5
Media
D B Corp
Neutral
374
-
6,886
2,297
2,590
27.4
28.2
21.0
23.4
17.8
16.0
4.2
3.6
23.7
23.1
2.8
2.4
HT Media
Neutral
81
-
1,890
2,693
2,991
12.6
12.9
7.9
9.0
10.3
9.0
0.9
0.8
7.8
8.3
0.3
0.2
Jagran Prakashan
Buy
184
225
6,020
2,283
2,555
28.0
28.0
10.6
12.3
17.3
15.0
3.7
3.2
21.4
21.4
2.6
2.3
Sun TV Network
Neutral
809
-
31,881
2,850
3,265
70.1
71.0
26.2
30.4
30.9
26.6
7.9
7.0
24.3
25.6
10.8
9.3
Hindustan Media
Neutral
273
-
2,005
1,016
1,138
24.3
25.2
27.3
30.1
10.0
9.1
1.9
1.7
16.2
15.8
1.3
1.1
Ventures
TV Today Network
Buy
263
344
1,570
608
667
21.5
22.3
15.7
19.2
16.8
13.7
2.6
2.2
16.1
16.0
2.2
1.9
Metals & Mining
Coal India
Neutral
260
-
161,548
84,638
94,297
21.4
22.3
24.5
27.1
10.6
9.6
4.4
4.2
42.6
46.0
1.4
1.3
Hind. Zinc
Neutral
243
-
102,823
14,252
18,465
55.9
48.3
15.8
21.5
15.4
11.3
2.5
2.2
17.0
20.7
7.2
5.6
Hindalco
Neutral
201
-
44,991
107,899
112,095
7.4
8.2
9.2
13.0
21.8
15.4
1.1
1.0
4.8
6.6
0.9
0.9
JSW Steel
Neutral
199
-
48,115
53,201
58,779
16.1
16.2
130.6
153.7
1.5
1.3
0.2
0.2
14.0
14.4
1.7
1.4
NMDC
Neutral
115
-
36,227
6,643
7,284
44.4
47.7
7.1
7.7
16.1
14.9
1.4
1.4
8.8
9.2
3.2
2.9
SAIL
Neutral
57
-
23,624
47,528
53,738
(0.7)
2.1
(1.9)
2.6
22.0
0.6
0.6
(1.6)
3.9
1.4
1.2
Vedanta
Neutral
245
-
91,108
71,744
81,944
19.2
21.7
13.4
20.1
18.3
12.2
1.6
1.4
8.4
11.3
1.7
1.3
Tata Steel
Neutral
507
-
49,275
121,374
121,856
7.2
8.4
18.6
34.3
27.3
14.8
1.7
1.6
6.1
10.1
1.0
1.0
Oil & Gas
GAIL
Neutral
382
-
64,582
56,220
65,198
9.3
10.1
27.1
33.3
14.1
11.5
1.3
1.2
9.3
10.7
1.3
1.1
ONGC
Neutral
168
-
216,048
137,222
152,563
15.0
21.8
19.5
24.1
8.6
7.0
0.7
0.7
8.5
10.1
1.9
1.7
Indian Oil Corp
Neutral
424
-
205,720
373,359
428,656
5.9
5.5
54.0
59.3
7.9
7.1
1.2
1.1
16.0
15.6
0.7
0.6
Stock Watch
June 13, 2017
Company Name
Reco
CMP
Target
Mkt Cap
Sales ( Čcr )
OPM(%)
EPS (Č)
PER(x)
P/BV(x)
RoE(%)
EV/Sales(x)
(Č)
Price ( Č)
( Č cr )
FY17E FY18E
FY17E
FY18E
FY17E
FY18E
FY17E
FY18E
FY17E
FY18E
FY17E
FY18E
FY17E
FY18E
Oil & Gas
Reliance Industries
Neutral
1,319
-
428,978
301,963
358,039
12.1
12.6
87.7
101.7
15.0
13.0
1.5
1.4
10.7
11.3
1.9
1.6
Pharmaceuticals
Alembic Pharma
Buy
550
648
10,364
3,101
3,966
19.7
20.5
21.4
25.5
25.7
21.6
5.5
4.5
23.0
22.8
3.3
2.4
Alkem Laboratories Ltd
Accumulate
1,929
2,161
23,063
5,853
6,901
17.1
18.4
74.6
85.0
25.8
22.7
5.5
4.6
21.1
20.2
3.9
3.3
Aurobindo Pharma
Buy
608
823
35,598
14,845
17,086
21.5
22.1
39.4
44.7
15.4
13.6
3.8
3.0
27.6
24.7
2.6
2.2
Aventis*
Neutral
4,024
-
9,267
2,206
2,508
16.6
16.8
128.9
139.9
31.2
28.8
5.3
4.2
21.6
23.5
4.0
3.3
Cadila Healthcare
Sell
548
450
56,137
9,220
11,584
18.4
20.3
14.5
18.7
37.8
29.3
8.1
6.5
23.5
24.6
6.4
4.9
Cipla
Sell
552
461
44,432
14,281
16,619
15.4
16.2
12.5
19.7
44.2
28.0
3.5
3.2
8.4
12.0
3.3
2.8
Dr Reddy's
Neutral
2,626
-
43,506
14,081
15,937
16.1
18.6
72.6
105.9
36.2
24.8
3.6
3.2
9.6
13.6
3.3
2.9
Dishman Pharma
Sell
143
1,718
1,890
22.7
22.8
9.5
11.3
10.1
10.9
3.3
2.9
GSK Pharma*
Neutral
2,465
-
20,883
2,927
3,290
11.8
16.2
34.4
49.6
71.7
49.7
10.4
10.8
13.9
21.3
6.9
6.2
Indoco Remedies
Sell
193
153
1,779
1,067
1,154
12.1
14.9
8.4
11.3
23.0
17.1
2.7
2.4
12.6
15.0
1.9
1.8
Ipca labs
Buy
498
710
6,285
3,211
3,593
13.9
14.5
15.4
19.4
32.3
25.7
2.6
2.3
8.2
9.5
2.1
1.8
Lupin
Buy
1,157
1,526
52,280
17,120
18,657
24.1
24.1
56.9
61.1
20.3
18.9
3.9
3.2
20.7
18.6
3.4
2.7
Natco Pharma
Neutral
1,022
-
17,812
2,065
1,988
33.1
33.7
27.9
25.7
36.6
39.8
10.7
9.1
29.2
22.9
8.7
8.8
Sun Pharma
Buy
533
712
127,915
30,264
32,899
29.0
26.9
32.7
31.6
16.3
16.9
3.5
3.0
22.2
18.7
4.0
3.5
Power
Tata Power
Neutral
79
-
21,341
36,916
39,557
17.4
27.1
5.1
6.3
15.5
12.5
1.4
1.3
9.0
10.3
1.6
1.4
NTPC
Neutral
158
-
130,278
86,605
95,545
17.5
20.8
11.8
13.4
13.4
11.8
1.4
1.3
10.5
11.1
2.8
2.8
Power Grid
Accumulate
206
223
107,771
25,315
29,193
88.2
88.7
14.2
17.2
14.6
12.0
2.2
1.9
15.2
16.1
8.9
8.0
Real Estate
Prestige Estate
Neutral
252
-
9,446
4,707
5,105
25.2
26.0
10.3
13.0
24.5
19.4
2.0
1.8
10.3
10.2
3.2
2.8
MLIFE
Buy
416
522
2,133
1,152
1,300
22.7
24.6
29.9
35.8
13.9
11.6
1.0
1.0
7.6
8.6
2.6
2.2
Telecom
Bharti Airtel
Neutral
365
-
146,065
105,086
114,808
34.5
34.7
12.2
16.4
30.0
22.3
2.0
1.9
6.8
8.4
2.3
2.0
Idea Cellular
Neutral
79
-
28,416
40,133
43,731
37.2
37.1
6.4
6.5
12.3
12.1
1.0
1.0
8.2
7.6
1.7
1.5
zOthers
Abbott India
Neutral
4,252
-
9,035
3,153
3,583
14.1
14.4
152.2
182.7
27.9
23.3
137.2
117.1
25.6
26.1
2.6
2.2
Asian Granito
Accumulate
393
447
1,181
1,066
1,169
11.6
12.5
13.0
16.0
30.2
24.6
2.9
2.6
9.5
10.7
1.4
1.2
Bajaj Electricals
Accumulate
350
395
3,540
4,801
5,351
5.7
6.2
10.4
13.7
33.5
25.5
4.1
3.7
12.4
14.5
0.7
0.7
Banco Products (India)
Neutral
219
-
1,563
1,353
1,471
12.3
12.4
14.5
16.3
15.1
13.4
20.8
18.8
14.5
14.6
1.1
117.7
Coffee Day Enterprises
Neutral
248
-
5,101
2,964
3,260
20.5
21.2
4.7
8.0
-
30.9
2.9
2.6
5.5
8.5
2.1
1.9
Ltd
Competent Automobiles Neutral
199
-
128
1,137
1,256
3.1
2.7
28.0
23.6
7.1
8.4
38.3
34.6
14.3
11.5
0.1
0.1
Elecon Engineering
Neutral
62
-
695
1,482
1,660
13.7
14.5
3.9
5.8
15.9
10.7
3.7
3.4
7.8
10.9
0.8
0.7
Stock Watch
June 13, 2017
Company Name
Reco
CMP
Target
Mkt Cap
Sales ( Čcr )
OPM(%)
EPS (Č)
PER(x)
P/BV(x)
RoE(%)
EV/Sales(x)
(Č)
Price ( Č)
( Č cr )
FY17E
FY18E
FY17E
FY18E
FY17E
FY18E
FY17E
FY18E
FY17E
FY18E
FY17E
FY18E
FY17E
FY18E
zOthers
Finolex Cables
Neutral
505
-
7,720
2,883
3,115
12.0
12.1
14.2
18.6
35.6
27.1
18.9
16.5
15.8
14.6
2.4
2.1
Garware Wall Ropes
Neutral
810
-
1,772
863
928
15.1
15.2
36.4
39.4
22.2
20.6
4.0
3.4
17.5
15.9
2.0
1.8
Goodyear India*
Neutral
886
-
2,044
1,598
1,704
10.4
10.2
49.4
52.6
17.9
16.8
82.8
72.6
18.2
17.0
1.0
137.5
Hitachi
Neutral
2,014
-
5,476
2,081
2,433
8.8
8.9
33.4
39.9
60.3
50.5
48.6
40.5
22.1
21.4
2.6
2.2
HSIL
Neutral
377
-
2,724
2,384
2,515
15.8
16.3
15.3
19.4
24.6
19.4
24.5
21.1
7.8
9.3
1.3
1.2
Interglobe Aviation
Neutral
1,141
-
41,244
21,122
26,005
14.5
27.6
110.7
132.1
10.3
8.6
61.7
44.0
168.5
201.1
1.9
1.5
Jyothy Laboratories
Neutral
382
-
6,938
1,440
2,052
11.5
13.0
8.5
10.0
44.9
38.2
10.9
10.1
18.6
19.3
5.1
3.6
Kirloskar Engines India
Neutral
386
-
5,582
2,554
2,800
9.9
10.0
10.5
12.1
36.8
31.9
15.4
14.5
10.7
11.7
1.8
1.6
Ltd
Linc Pen & Plastics
Neutral
263
-
388
382
420
9.3
9.5
13.5
15.7
19.5
16.7
3.3
2.9
17.1
17.3
1.1
1.0
M M Forgings
Neutral
611
-
737
546
608
20.4
20.7
41.3
48.7
14.8
12.5
83.6
74.0
16.6
17.0
1.2
1.1
Manpasand Bever.
Neutral
755
-
4,320
836
1,087
19.6
19.4
16.9
23.8
44.7
31.7
5.4
4.7
12.0
14.8
4.9
3.7
Mirza International
Neutral
163
-
1,961
963
1,069
17.2
18.0
6.1
7.5
26.6
21.7
4.1
3.5
15.0
15.7
2.2
2.0
MT Educare
Neutral
64
-
255
366
417
17.7
18.2
9.4
10.8
6.9
5.9
1.5
1.3
22.2
22.3
0.6
0.5
Narayana Hrudaya
Neutral
337
-
6,896
1,873
2,166
11.5
11.7
2.6
4.0
127.6
85.1
7.8
7.1
6.1
8.3
3.8
3.3
Navkar Corporation
Buy
213
265
3,033
347
371
43.2
37.3
6.7
6.0
31.9
35.5
2.2
2.0
6.2
10.6
9.9
9.2
Navneet Education
Neutral
189
-
4,422
1,062
1,147
24.0
24.0
6.1
6.6
31.1
28.6
6.4
5.7
20.6
19.8
4.2
3.9
Nilkamal
Neutral
1,985
-
2,962
1,995
2,165
10.7
10.4
69.8
80.6
28.4
24.6
113.4
98.5
16.6
16.5
1.5
1.3
Page Industries
Neutral
16,350
-
18,237
2,450
3,124
20.1
17.6
299.0
310.0
54.7
52.7
364.2
278.0
47.1
87.5
7.5
5.9
Parag Milk Foods
Neutral
227
-
1,912
1,919
2,231
9.3
9.6
9.5
12.9
24.1
17.6
3.7
3.1
15.5
17.5
1.2
1.0
Quick Heal
Neutral
210
-
1,472
408
495
27.3
27.0
7.7
8.8
27.1
23.9
2.5
2.5
9.3
10.6
2.8
2.3
Radico Khaitan
Buy
128
147
1,704
1,667
1,824
13.0
13.2
6.7
8.2
19.3
15.6
1.7
1.6
9.0
10.2
1.4
1.3
Relaxo Footwears
Neutral
499
-
5,991
2,085
2,469
9.2
8.2
7.6
8.0
66.0
62.8
25.6
21.8
17.9
18.8
3.0
2.5
S H Kelkar & Co.
Neutral
290
-
4,201
1,036
1,160
15.1
15.0
6.1
7.2
47.6
40.5
5.1
4.7
10.7
11.5
3.9
3.5
Siyaram Silk Mills
Accumulate
2,311
2,500
2,166
1,574
1,769
12.5
12.7
97.1
113.1
23.8
20.4
3.7
3.2
15.4
15.5
1.6
1.4
Styrolution ABS India*
Neutral
811
-
1,426
1,440
1,537
9.2
9.0
40.6
42.6
20.0
19.0
51.0
46.4
12.3
11.6
0.9
0.8
Surya Roshni
Neutral
285
-
1,251
3,342
3,625
7.8
7.5
17.3
19.8
16.5
14.4
31.4
25.2
10.5
10.8
0.6
0.6
Team Lease Serv.
Neutral
1,295
-
2,214
3,229
4,001
1.5
1.8
22.8
32.8
56.9
39.4
6.1
5.3
10.7
13.4
0.6
0.5
The Byke Hospitality
Neutral
190
-
763
287
384
20.5
20.5
7.6
10.7
25.0
17.8
5.2
4.2
20.7
23.5
2.7
2.0
Transport Corporation of
Neutral
304
-
2,325
2,671
2,911
8.5
8.8
13.9
15.7
21.9
19.4
3.0
2.7
13.7
13.8
1.0
0.9
India
Stock Watch
June 13, 2017
Company Name
Reco
CMP
Target Mkt Cap
Sales ( Čcr )
OPM(%)
EPS (Č)
PER(x)
P/BV(x)
RoE(%)
EV/Sales(x)
(Č)
Price ( Č)
( Č cr )
FY17E FY18E FY17E FY18E FY17E FY18E FY17E FY18E FY17E FY18E FY17E FY18E FY17E FY18E
zOthers
TVS Srichakra
Neutral
4,043
-
3,096
2,304
2,614
13.7
13.8
231.1
266.6
17.5
15.2
454.3
357.7
33.9
29.3
1.3
1.2
UFO Moviez
Neutral
383
-
1,056
619
685
33.2
33.4
30.0
34.9
12.8
11.0
1.8
1.5
13.8
13.9
1.4
1.1
Visaka Industries
Neutral
480
-
762
1,051
1,138
10.3
10.4
21.0
23.1
22.8
20.7
61.5
57.6
9.0
9.2
1.0
0.9
VRL Logistics
Neutral
327
-
2,980
1,902
2,119
16.7
16.6
14.6
16.8
22.4
19.4
4.9
4.3
21.9
22.2
1.7
1.5
VIP Industries
Accumulate
195
218
2,762
1,270
1,450
10.4
10.4
5.6
6.5
34.9
30.1
7.2
6.3
20.7
21.1
2.2
1.9
Navin Fluorine
Accumulate
3,200
3,650
3,133
789
945
21.1
22.4
120.1
143.4
26.6
22.3
4.3
3.7
17.8
18.5
3.9
3.2
Source: Company, Angel Research; Note: *December year end; #September year end; &October year end; Price as on June 12, 2017
Market Outlook
June 13, 2017
Research Team Tel: 022 - 39357800
DISCLAIMER
Angel Broking Private Limited (hereinafter referred to as “Angel”) is a registered Member of National Stock Exchange of India
Limited,Bombay Stock Exchange Limited and Metropolitan Stock Exchange Limited. It is also registered as a Depository Participant with
CDSL and Portfolio Manager with SEBI. It also has registration with AMFI as a Mutual Fund Distributor. Angel Broking Private Limited is a
registered entity with SEBI for Research Analyst in terms of SEBI (Research Analyst) Regulations, 2014 vide registration number
INH000000164. Angel or its associates has not been debarred/ suspended by SEBI or any other regulatory authority for accessing
/dealing in securities Market. Angel or its associates/analyst has not received any compensation / managed or
co-managed public offering of securities of the company covered by Analyst during the past twelve months.
This document is solely for the personal information of the recipient, and must not be singularly used as the basis of any investment
decision. Nothing in this document should be construed as investment or financial advice. Each recipient of this document should make
such investigations as they deem necessary to arrive at an independent evaluation of an investment in the securities of the companies
referred to in this document (including the merits and risks involved), and should consult their own advisors to determine the merits and
risks of such an investment.
Reports based on technical and derivative analysis center on studying charts of a stock's price movement, outstanding positions and
trading volume, as opposed to focusing on a company's fundamentals and, as such, may not match with a report on a company's
fundamentals. Investors are advised to refer the Fundamental and Technical Research Reports available on our website to evaluate the
contrary view, if any.
The information in this document has been printed on the basis of publicly available information, internal data and other reliable
sources believed to be true, but we do not represent that it is accurate or complete and it should not be relied on as such, as this
document is for general guidance only. Angel Broking Pvt. Limited or any of its affiliates/ group companies shall not be in any way
responsible for any loss or damage that may arise to any person from any inadvertent error in the information contained in this report.
Angel Broking Pvt. Limited has not independently verified all the information contained within this document. Accordingly, we cannot
testify, nor make any representation or warranty, express or implied, to the accuracy, contents or data contained within this document.
While Angel Broking Pvt. Limited endeavors to update on a reasonable basis the information discussed in this material, there may be
regulatory, compliance, or other reasons that prevent us from doing so.
This document is being supplied to you solely for your information, and its contents, information or data may not be reproduced,
redistributed or passed on, directly or indirectly.
Neither Angel Broking Pvt. Limited, nor its directors, employees or affiliates shall be liable for any loss or damage that may arise from
or in connection with the use of this information.